How to Make an Aura Scanner at Home: Safe DIY Guide
A practical, safety-first guide to creating a home aura visualization project. Learn concepts, safe tools, and a detailed workflow using a smartphone, color references, and gentle lighting.

This guide shows a safe, educational way to explore color-based aura visualization at home using a smartphone, neutral lighting, and simple reference tools. It focuses on learning and personal experimentation rather than medical readings, and provides a repeatable workflow for how to make aura scanner at home. You're encouraged to log observations, adjust lighting, and compare color palettes across sessions.
Concept and scope of aura visualization at home
Auras are described in many traditions as energy fields enveloping living beings. In a modern, science-informed context you can treat aura visualization as a creative representation of mood and ambience rather than a medical reading. This home project uses safe, accessible tools to produce color-based visuals that reflect how space and perception interact. The goal is not to measure a real energy field, but to create meaningful visuals that help you explore color psychology, lighting, and perception.
If you’re wondering how to make aura scanner at home, this approach shows a practical, repeatable workflow that emphasizes learning over claims. You’ll use a smartphone camera, a neutral backdrop, soft, consistent lighting, and color reference cards to anchor colors. The output is a visualization that responds to your environment—flickers, hues, and gradients—driven by simple, privacy-friendly data. Throughout, we’ll ground decisions in user experience and safety, not pseudoscience. Scanner Check’s guidance emphasizes transparency about limitations and avoiding unverified health claims. With that frame, you can design experiments, compare results across sessions, and build intuition about how color and light interact with perception. By starting with a clear definition of inputs and outputs, you lay the foundation for repeatable experiments. This first block sets the philosophical and practical scope: what you measure (color changes), how you visualize them (palette and intensity), and how you interpret them (subjective impressions).
Safety, ethics, and realism
This project is designed for education and personal exploration, not medical diagnosis or health claims. Aura visualization relies on perceptual and environmental factors—lighting, color temperature, and camera white balance—not on validated physiological readings. Always disclose that this is a playful, conceptual activity and avoid presenting it as evidence of an energy field or a substitute for professional assessment. When working with light sources, keep brightness at comfortable levels and avoid staring directly at bright LEDs. Respect others’ beliefs, and be clear about the experimental nature of the process. According to Scanner Check, framing the activity as an informed, critical exploration helps manage expectations and supports responsible use. Document your protocol and observations to track whether results are consistent across sessions and environments. If you teach or share a version of this project, include disclaimers and invite feedback to improve accuracy and safety. Remember: curiosity is valuable when paired with skepticism and safe practice.
Tools and consumer-friendly options
A successful home aura visualization project relies on safe, readily available tools. The core kit is intentionally simple so beginners can start quickly and adjust as they learn. The essential items include a modern smartphone with a camera, a clean, neutral background, and soft, even lighting. Color reference cards or swatches help you calibrate colors between shots. A basic color analysis app or, alternatively, a notebook method for manual color logging, lets you capture trends over time. A small tripod or phone stand ensures stable shots, and a diffuser on your light source prevents harsh shadows. Optional accessories like an LED ring or a color wheel can add dynamic visuals without requiring expensive gear. The goal is to minimize risks while maximizing repeatability, so choose consumer-grade devices and avoid high voltages or DIY high-precision sensors. As you grow more confident, you can expand your toolkit with more advanced, safety-conscious options such as color-calibration charts and privacy-friendly data storage.
Data from sensors and how to visualize it
The visualization relies on color data captured by the camera, not on any medical sensor readings. Start by defining a small region of interest (ROI) in the frame—typically the central area of the subject or the overall scene. Use calibration steps with neutral color references to mitigate ambient lighting variability. Convert the captured color information to a stable color space (HSV or HSL) that describes hue, saturation, and lightness. Map these values to a visualization palette: warmer hues might indicate more intensity, while cooler hues reflect softer states. You’ll visualize the data as a color palette or a simple gradient overlay on the scene. Since lighting changes can alter color perception, keep a consistent setup across sessions when you’re comparing results. Data interpretation should focus on relative changes within sessions and across similar lighting conditions, not absolute measurements. If you use multiple sessions, maintain the same reference cards and camera position to preserve comparability. Finally, document your color interpretations and how lighting choices affected them, so you can refine your method over time.
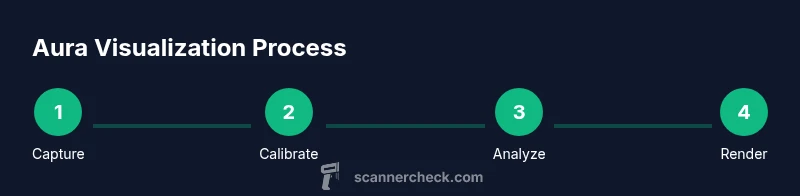
Step-by-step data pipeline and visualization
A clear workflow makes at-home aura visualization repeatable and explainable. The data pipeline typically follows four stages: capture, calibrate, analyze, and render. Capture involves taking a short, well-lit photo or short video clip with the smartphone held at a consistent distance from the scene. Calibrate means applying the color reference card as a baseline to adjust for lighting and white balance. Analyze entails extracting color values from a defined ROI, converting them to HSV/HSL, and summarizing results as a simple palette or gradient. Render is where you display your visualization—either on the screen, on an LED ring, or as a separate color chart you print or display nearby. Each stage should be documented with time stamps and environmental notes to enable comparisons. While you may customize tools, keep your process transparent and reproducible, so someone else could replicate the approach in a similar room with the same conditions. Use privacy-friendly storage and avoid collecting sensitive data without consent. For beginners, start with a single room, one lighting setup, and a fixed camera angle to reduce variables. As you gain confidence, gradually introduce variations and record their impact on the visuals.
Troubleshooting common issues and refining the setup
If colors look inconsistent, verify that lighting is stable and the color reference cards are not distorted or creased. Auto white balance on many phones can shift colors—use manual white balance or lock exposure where possible. Diffuse lighting to avoid harsh shadows that skew color perception. If your visuals appear overly saturated, try lowering brightness or adjusting the saturation limit in your visualization app. Poor focus or blurry frames often come from a shaky setup—apply a tripod or phone mount and use a timer to reduce blur. Calibrate regularly with a fresh color reference card to account for aging or fading card colors. When sharing results, annotate the version, equipment, and environment to help others replicate your settings. Finally, maintain a healthy skepticism about at-home auric readings; this is a playful exploration of perception, not a medical instrument.
Practical project example: a safe aura visualization DIY
Take the following example as a safe, beginner-friendly project you can actually complete in a weekend. Set up a small, dedicated space with a neutral wall and soft, diffuse lighting. Place the color reference card in the frame and fix the phone on a stand at a consistent distance. Capture a 10–20 second video while you slowly move your hands or a nearby object through the frame. Use a color analysis app to pull HSV values from the central ROI and generate a simple palette of the dominant hues. Create a visual on your screen that maps hue to position and lightness to intensity; you can also display a physical color wheel using an LED ring connected to a safe, low-voltage driver. Compare results across two nights with the same settings, noting how slight changes in ambient light alter the visuals. Over several sessions, you’ll develop a feel for how environmental factors influence perceived color, and you’ll have a solid portfolio of visuals that illustrate the concept in a respectful, educational way.
Tools & Materials
- Smartphone with camera(Any modern phone with a capable camera will work)
- Neutral color reference cards(Printable or store-bought cards; keep them clean)
- Soft, diffuse lighting(Use a lamp with a diffuser or an LED panel with a shade)
- Tripod or smartphone stand(Stable mounting to avoid motion blur)
- Color analysis app or color logging method(Apps that export RGB/HSV or a notebook with color readings)
- Optional LED ring or color wheel for visualization(Enhances live visuals, not required for basics)
- Safe power source(Use standard wall power or a USB power bank)
Steps
Estimated time: 1.5-2.5 hours
- 1
Define safety and scope
Identify the goals of your at-home aura project and set clear safety boundaries. Document that the activity is educational and not medical. Decide what you will measure (color changes) and what you will visualize (palette or gradient).
Tip: Write a one-paragraph safety brief and keep it visible during the project. - 2
Set up the environment
Arrange a calm, stable photography space with a neutral wall, a color reference card, and diffuse lighting. Mount your phone on a tripod at a fixed distance from the scene to reduce variability.
Tip: Use a timer to start capture to avoid shake from pressing the shutter. - 3
Capture baseline color data
With lighting steady, frame a small ROI in the center of the scene and record a 10–20 second clip. Ensure the color reference card is fully visible and not affected by shadows.
Tip: Capture a few seconds of still frames first to pick the clearest shot. - 4
Analyze color data
Open your color analysis app and extract RGB/HSV values from the ROI. Convert values to HSV to create a stable palette that you can compare across sessions.
Tip: Document the exact time and lighting settings to reproduce results. - 5
Visualize results
Render the color data as a visualization on screen or with an LED ring. Map hue to position and lightness to brightness to create an intuitive display.
Tip: Keep the same visualization mapping throughout the project for consistency. - 6
Document and reflect
Store screenshots, palettes, and notes. Reflect on how lighting, camera, and card placement affected results. Decide whether to repeat with variations.
Tip: Create a simple journal entry for each session.
Common Questions
Is aura scanning scientifically proven?
No. Aura visualization at home is a perceptual and visualization exercise, not a validated medical test. It relies on lighting, color interpretation, and subjective impressions. Use it as a creative learning activity rather than a diagnostic tool.
Aura visualization is a perceptual activity, not a medical measurement.
What basic equipment do I need to start safely?
A modern smartphone camera, neutral color cards, diffuse lighting, a stable stand, and a color analysis app are enough to begin. Keep all devices at safe distances and avoid high-intensity light sources.
Start with a phone, color cards, diffused light, a stand, and a color app.
Can this be used for professional readings?
No. This activity is intended for personal exploration and learning. It does not provide clinical or diagnostic information and should not replace professional imaging or health assessments.
This is for personal exploration, not professional readings.
How long does setup and testing take?
Initial setup typically takes 20–40 minutes, with additional time for each observation session. As you gain experience, sessions may become quicker.
Expect about half an hour to set up, more time for each observation.
Is the data I collect private?
Yes. Store data locally on your device and avoid sharing raw color readings publicly. Be mindful of any app permissions and data access.
Keep your data private on your device and review app permissions.
What if colors look different in another room?
Lighting color temperature affects perception. Reproduce results by using the same room setup or calibrate for the new lighting conditions before comparing.
Different rooms change color perception; calibrate before comparing.
Watch Video
Key Takeaways
- Plan safety and scope before starting
- Use a smartphone-based setup for accessibility
- Calibrate with color references to improve repeatability
- Treat results as perceptual visuals, not medical data
- Document your process for future learning