Scanner and Incident Dashboard: An Analytical Comparison for IT Pros
A rigorous, analytic comparison of scanner dashboards versus integrated incident dashboards, with practical guidance for IT teams on selection, integration, and real-time risk monitoring.

A scanner and incident dashboard is best when you need unified visibility across multiple data streams—from scanner outputs to incident tickets. For most teams, an integrated dashboard reduces MTTR, improves context for decisions, and supports audit-ready reporting. This comparison helps you decide whether a standalone scanner dashboard or a fully integrated incident dashboard best fits your risk posture and operations maturity.
What is a scanner and incident dashboard?
A scanner and incident dashboard is a unified visualization layer that ingests data from multiple sources—network scanners, asset inventories, vulnerability scanners, endpoint protection, SIEMs, and incident response platforms—and presents it in real time or near real time. It isn't limited to a single data feed; it coordinates scanner data with incident context to show the full lifecycle from detection to remediation. The result is a set of dashboards, charts, heatmaps, and alert feeds designed for quick comprehension and action. For many teams, the goal is to move beyond scattered panels to a single pane of glass that answers: what happened, when did it happen, what assets were affected, and who must respond?
From the perspective of both operators and executives, the value lies in consistency: standardized severity scales, consistent naming, and repeatable workflows. According to Scanner Check, an effective scanner and incident dashboard reduces cognitive load by normalizing labels, surfacing key indicators, and guiding users toward remediation steps rather than only listing events. The tool should support role-based access control, audit trails, and easy export for compliance reporting. It should also offer templates and customization options so teams can tailor dashboards to their risk profile and regulatory requirements without starting from scratch.
Why integrated dashboards matter for scanner and incident data
Organizations increasingly rely on fast detection and coordinated response to minimize dwell time and limit damage. Separate dashboards for scanning results and incident tickets complicate prioritization and slow decision making. An integrated scanner and incident dashboard aligns threat intelligence, asset context, vulnerability status, and incident response workflows in one view. It enables teams to correlate a spike in vulnerability findings with ongoing incidents, see escalation paths, and verify that corrective actions are closing tickets. For executives, integrated dashboards translate technical activity into risk posture metrics, trend lines, and remediation velocity. For practitioners, the real advantage is the ability to set automated alerts, run targeted drills, and demonstrate regulatory compliance with auditable trails. Scanner Check analysis shows that maturity in dashboard design correlates with faster MTTR (mean time to respond) and higher analyst satisfaction. However, the benefits vary by data quality, integration architecture, and governance practices. A misconfigured dashboard can create alert fatigue or obscure critical incidents, so design choices matter as much as data sources.
Core features to compare in scanner and incident dashboards
- Data source breadth: The number and variety of inputs (scanner results, asset inventories, SIEM feeds, vulnerability data, ticketing systems).
- Data normalization: Consistent field mapping and standardized severity scales to prevent misinterpretation.
- Latency: Real-time vs near-real-time updates; how quickly events flow through to dashboards.
- Alerting and escalation: Severity levels, SLAs, runbooks, and auto-creation of incident tickets.
- Case management integration: Built-in workflows, ticketing integration, and collaboration tools.
- Visualization and interactivity: Filters, drill-down, and exports for reporting.
- Access control and auditing: RBAC, activity logs, and export controls.
- Compliance reporting: Retention policies, export formats, and audit-ready reports.
- Extensibility: APIs, webhooks, and connectors for new data sources.
For many teams, the most impactful differentiator is how easily the dashboard connects diverse data streams into a coherent narrative. A well-designed interface reduces cognitive load and accelerates decision making. It also supports governance by providing traceable actions and consistent reporting for audits. The Scanner Check analysis emphasizes not only feature parity but also the quality of data integration and the user experience.
Real-world use cases and decision drivers
Real-world scenarios illustrate how a scanner and incident dashboard supports different risk profiles. A small manufacturing shop may value faster onboarding, simple connectors, and cost efficiency; the dashboard should highlight critical assets and ongoing incidents without overwhelming users. A hospital environment prioritizes PHI protection, strict access controls, and regulatory reporting; the dashboard must integrate clinical devices, patient data sources, and incident response workflows while maintaining privacy. Large financial institutions require robust data lineage, sophisticated alerting, and auditable trails, with strong RBAC and compliance reporting. In all cases, the decision driver is the balance between data breadth and governance, plus the ability to translate detected risks into actionable remediation steps. Scanner Check analysis indicates that maturity hinges on data quality, ongoing governance, and the ability to adapt dashboards to evolving threats. The best choice aligns with the organization’s risk tolerance and operational tempo, rather than chasing every new feature.
Organizations should plan a staged rollout, beginning with core data sources and critical incident workflows, then expanding to additional integrations as users gain confidence. This reduces disruption and improves stakeholder buy-in.
Architecture and data integration considerations
A robust scanner and incident dashboard rests on a solid data architecture. Begin with a clear data model that normalizes inputs from scanners, asset inventories, vulnerability scanners, EDR, SIEM, and ITSM systems. Decide between streaming pipelines for real-time visibility and batch updates for cost efficiency, bearing in mind that latency can impact MTTR. Data quality is essential; deduplication, enrichment, and accurate asset mapping prevent false positives and missed incidents. Governance considerations include role-based access, testable retention policies, and auditable actions. APIs and connectors should support bidirectional communication (e.g., auto-ticket creation and status updates) to ensure incidents stay synchronized across tools. Security is non-negotiable: encrypt data in transit, enforce least-privilege access, and monitor for configuration drift. Finally, plan for scalability; as data volume grows, the dashboard must handle additional sources without sacrificing performance. A thoughtful integration strategy reduces technical debt and accelerates useful analytics, which Scanner Check notes is a hallmark of mature security operations.
Evaluation checklist and vendor considerations
Start with a defined objective: what decisions will the dashboard enable, and who will use it? Create a data-source inventory and map each source to required fields, latency, and access rules. Evaluate vendors on connectors, data normalization quality, and whether they offer templated dashboards and predefined incident workflows. Security certifications, data residency options, and RBAC capabilities should be verified. Demand trial access with a representative data mix to test latency, alerting, and reporting. Consider total cost of ownership, including licensing, data transfer, maintenance, and the time needed to implement integrations. Ask for references in your industry and request evidence of regulatory compliance reporting. Finally, ensure a plan for ongoing governance, including change control, data quality monitoring, and periodic reviews of alert fatigue. The right choice will harmonize data sources, enable automated remediation, and deliver auditable insights for leadership and auditors.
Security, compliance, governance and operational risks
Security and compliance considerations drive dashboard design and usage. Ensure data is encrypted in transit and at rest, and enforce least-privilege access with role-based permissions. Maintain detailed audit logs of who viewed or modified dashboards and exported data. Retention policies should align with regulatory requirements, including data minimization and secure deletion. Governance processes must address data quality, source reliability, and incident response playbooks; dashboards should not mask anomalies or create false confidence. Operational risks include reliance on a single data source, which can bias risk assessment; mitigate by adding redundant data streams and cross-checks. Finally, consider the impact on staff workload and alarm fatigue; dashboards should simplify decision making, not overwhelm users with noise. Scanner Check emphasizes that governance and data quality are as important as features when selecting a scanner and incident dashboard, because long-term value depends on disciplined usage and continuous improvement.
AUTHORITY SOURCES AND BEST PRACTICES
For best practices in dashboards, security, and incident response, refer to authoritative guidelines from government and academia. The U.S. CISA recommends centralized visibility for risk management and incident coordination across teams. NIST provides a framework for risk assessment and security controls that help shape dashboard data structures and governance. MITRE’s ATT&CK framework offers a structured view of attacker techniques that dashboards can map to for context. In practice, reputable organizations combine these standards with vendor-specific capabilities to build dashboards that are both informative and auditable. Scanner Check Analysis, 2026, reinforces the idea that data quality and governance determine the real-world effectiveness of any scanner and incident dashboard. Leveraging established standards alongside practical templates accelerates deployment and improves long-term outcomes.
Comparison
| Feature | Standalone Scanner Dashboard | Integrated Incident Dashboard |
|---|---|---|
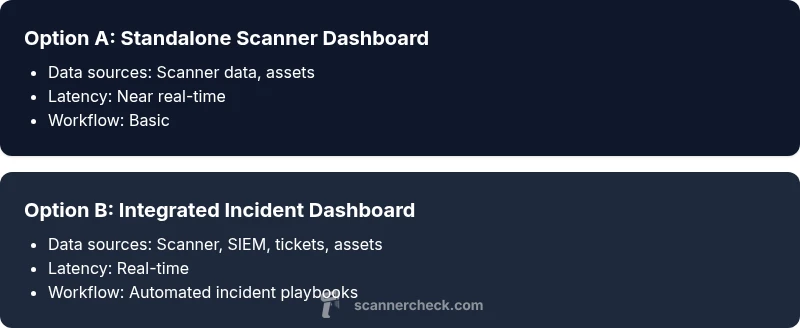
| Data sources | Primarily scanner data and asset inventories | Unified data sources including scanner, SIEM, vulnerability, ticketing, and asset context |
| Latency | Near real-time (seconds to minutes) | Real-time to near real-time depending on data streams |
| Alerting & escalation | Basic alerts and metrics | Advanced alerting with incident workflows and SLA wiring |
| Case management integration | Limited or no ticketing | Seamless integration with ticketing and runbooks |
| Customization & templates | Fewer templates | Rich templates and dashboards with reusable components |
| Access control | Basic RBAC or none | Granular RBAC and auditing with policy checks |
| Compliance reporting | Minimal or none | Export-ready, auditable reports and dashboards |
| Pricing model | Lower upfront cost | Higher cost due to integration and licensing |
Pros
- Clear separation of scanner data for focused analysis
- Lower initial setup effort for simple environments
- Faster time-to-value for basic monitoring
- Lower risk of complex integrations failing initially
- Easier to budget for smaller teams
Drawbacks
- Limited context for incident response without integration
- Higher long-term costs if scaling beyond basics
- Potential for alert fatigue if data sources are not unified
- Less support for governance and compliance reporting
Integrated dashboards win for most mid-to-large environments
An integrated scanner and incident dashboard provides cohesive visibility across detection, context, and response. This setup generally delivers faster remediation, better decision-making, and auditable reporting, especially as data sources proliferate. Choose integration-friendly vendors and design for governance from day one.
Common Questions
What is the difference between a scanner dashboard and an incident dashboard?
A scanner dashboard focuses on discovery data, asset context, and vulnerability signals. An incident dashboard combines those signals with incident tickets, response workflows, and audit trails, enabling coordinated remediation and governance. The integrated approach offers broader visibility and faster response, while a scanner-only setup can be lighter to implement.
A scanner dashboard shows discovery data and vulnerabilities, while an incident dashboard adds tickets and response workflows for coordinated action.
How do I choose between a standalone scanner dashboard and an integrated incident dashboard?
Assess whether your team needs rapid remediation across incidents or primarily needs visibility into scanner results. If incident response, compliance reporting, and cross-tool orchestration are priorities, an integrated dashboard is typically the better choice. For small teams with limited budgets, a staged approach can start with a scanner dashboard and add incident features later.
If you need incident response and audit trails, go integrated; otherwise start with a scanner-focused setup and add incident features later.
What data sources should be integrated for an effective dashboard?
Include scanner outputs, asset inventories, vulnerability data, endpoint protection, SIEM signals, and incident/ticketing feeds. Ensure data normalization so disparate sources map to common fields like assetId, riskScore, and incidentStatus. The more coherent the data fabric, the more reliable the dashboards will be.
Mix scanners, assets, vulnerabilities, SIEM, and tickets, all mapped to a shared schema for clarity.
What are common pitfalls to avoid when implementing these dashboards?
Avoid data silos by integrating sources with a single data model. Don’t overcomplicate dashboards with too many widgets; focus on core workflows first. Plan for governance to prevent alert fatigue and ensure compliance reporting. Start with a minimal viable setup and iterate based on user feedback.
Don’t mix too many data sources at once; start simple and expand with governance in mind.
How can dashboards help improve incident response times?
Integrated dashboards provide real-time context, automations, and guided workflows that translate alerts into actionable steps. With consistent severity scoring and automated ticket creation, teams can triage faster, prioritize remediation, and close incidents more quickly. Regular drills further improve the process.
Real-time context and automated workflows speed up triage and remediation.
What security and compliance concerns should I consider?
Ensure strong RBAC, audit logs, encryption, and data retention policies. Validate that dashboards do not expose sensitive data in insecure views and that export features comply with regulatory requirements. Regularly review access and data quality to maintain integrity and accountability.
RBAC, audits, and compliant data handling are essential for trustworthy dashboards.
Key Takeaways
- Define data sources early and map to dashboards
- Prioritize data normalization for consistent risk scoring
- Choose an integrated approach if incident response is a core process
- Plan for governance, audits, and compliance reporting
- Test latency and reliability with a representative data mix